Refurbishment and modernisation of heat management at the National Cancer Institute in Bratislava
CAMASE successfully participated in a public tender announced by the National Cancer Institute (NCI) in Bratislava in 2013 to refurbish and modernise the NCI’s heat management system. A refurbishment of the main steam boiler plant and a modernisation of two hot water boiler plants were the primary components of this project. The tender was intended to achieve efficiencies, in particular by decreasing the consumption of the primary fuel used to produce heat, steam and hot water.
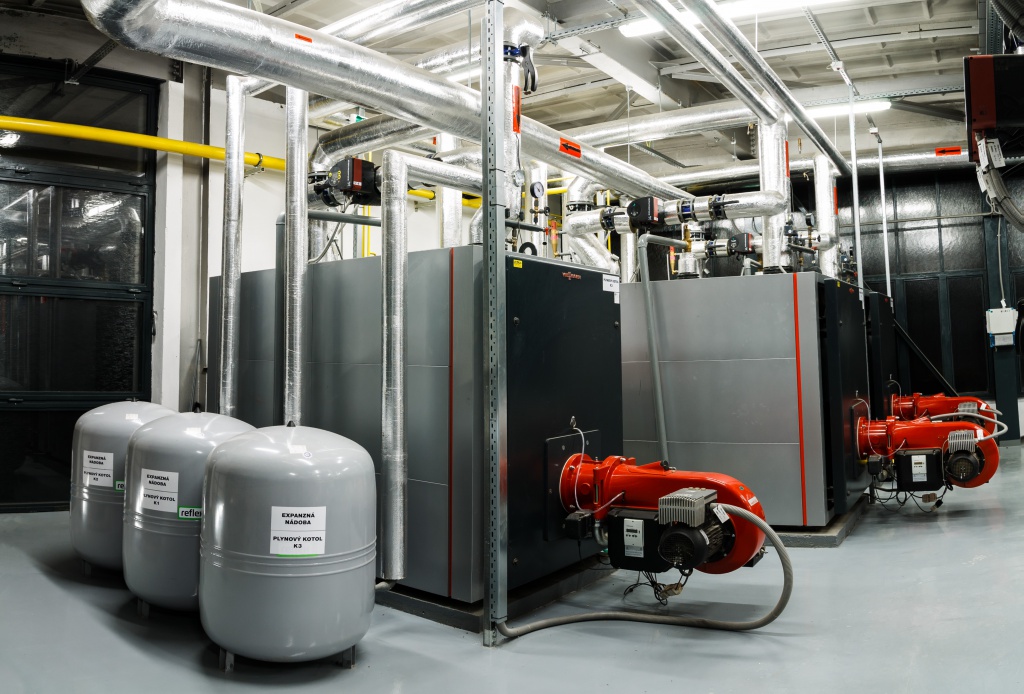
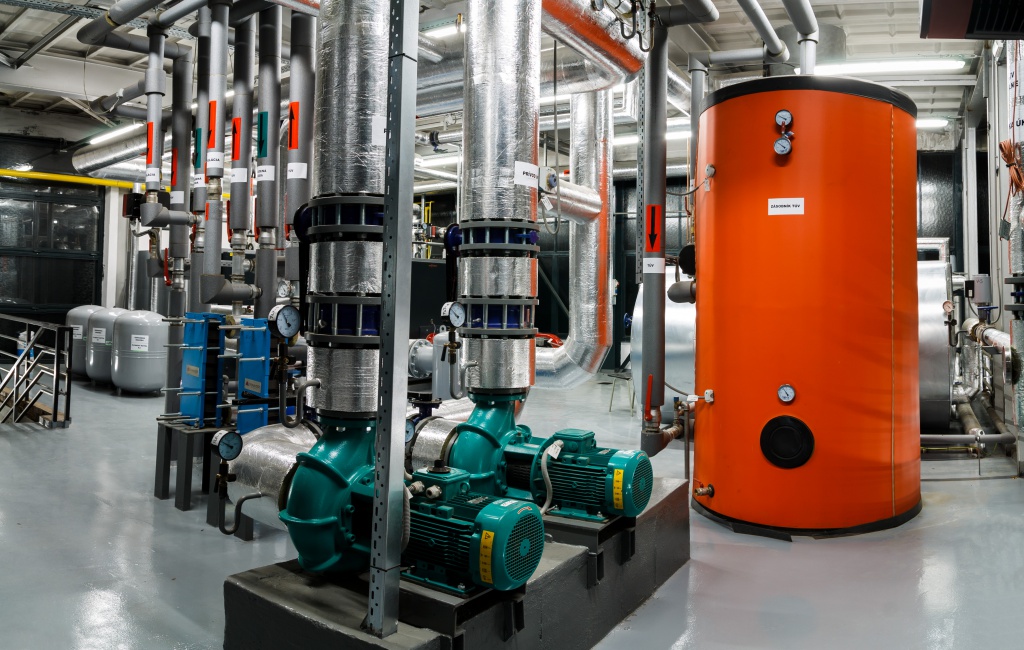
The installation of new, high efficiency boilers and gas burners with smooth output modulation, as well as the deployment of energy management services for operating the heat sources, delivered a substantial reduction in the NCI’s natural gas consumption. The delivery and installation of modern equipment and a control system played a major role in these efforts. In practical terms, the project involved the acquisition of a highly efficient energy management system, limiting operating costs, complying with legal regulations and decreasing environmental emissions.
The control system in the low-pressure gas hot water boiler plant was modernised within the scope of the project as well; this boiler plant provides heat and hot water to three accommodation facilities for NCI employees.
The control system for the heat sources supplying heat to the Radiation Therapy building, located directly within the building itself, was also modernised and is now used to independently supply heat and hot water.
CAMASE provided the following scope of services to the NCI after successfully completing the refurbishment and modernisation of its heating equipment:
- Comprehensive administration of heat sources
- Maintenance, repairs and operation of the equipment
- Emergency services and technical equipment service
- Specialised inspections and testing of technological equipment, controls and instrumentation
Energy management
- increasing the reliability of the equipment during its operation under specialised supervision
- capital appreciation
- guaranteed long-term efficiency
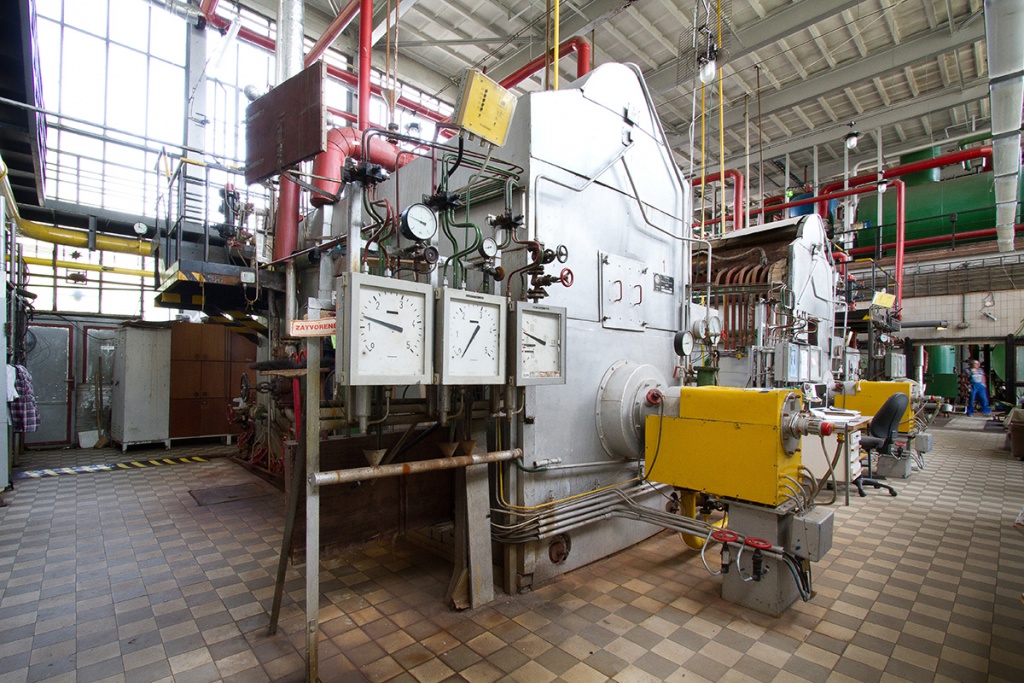
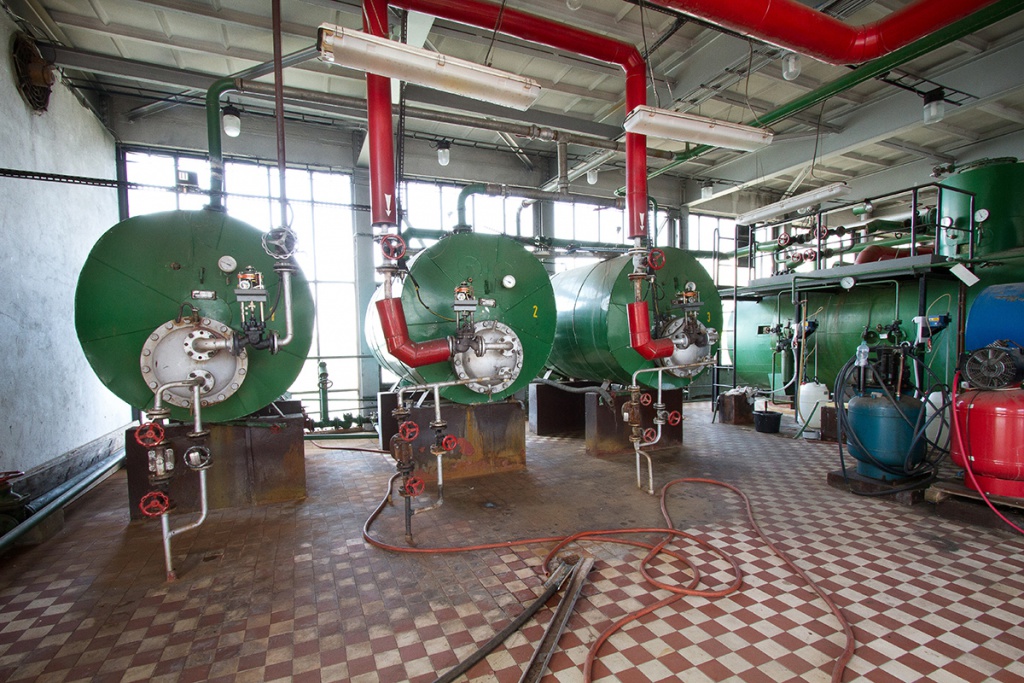
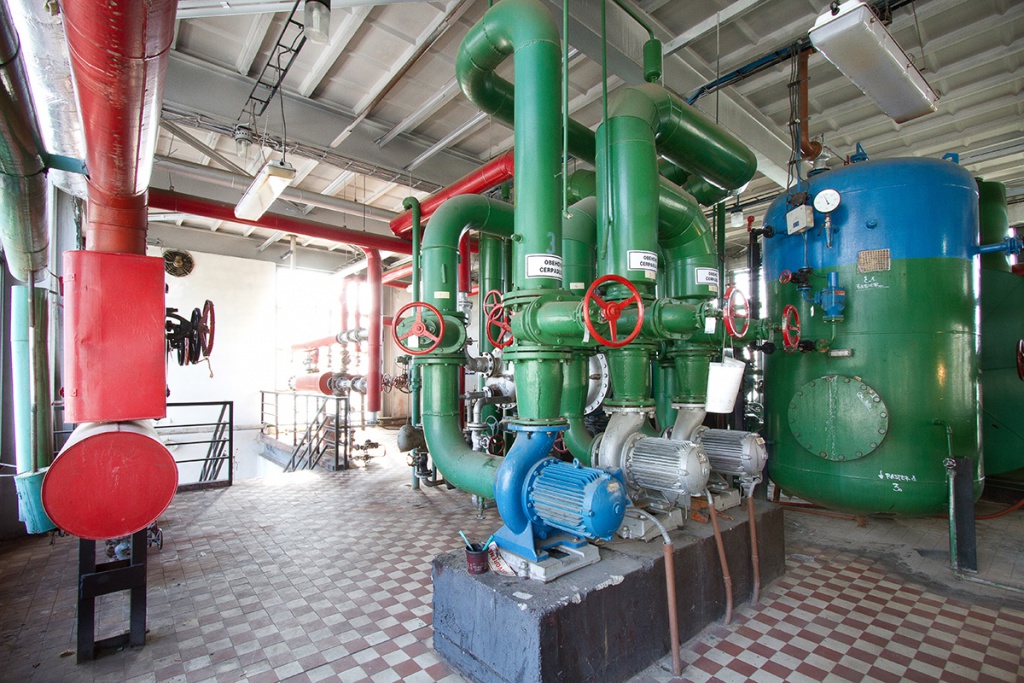
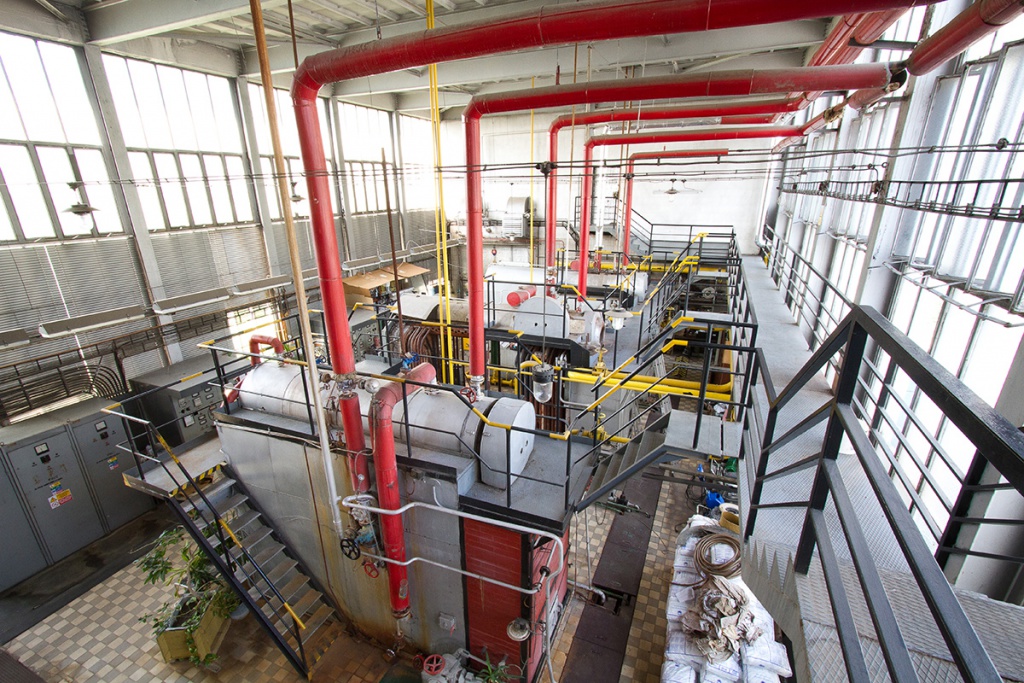
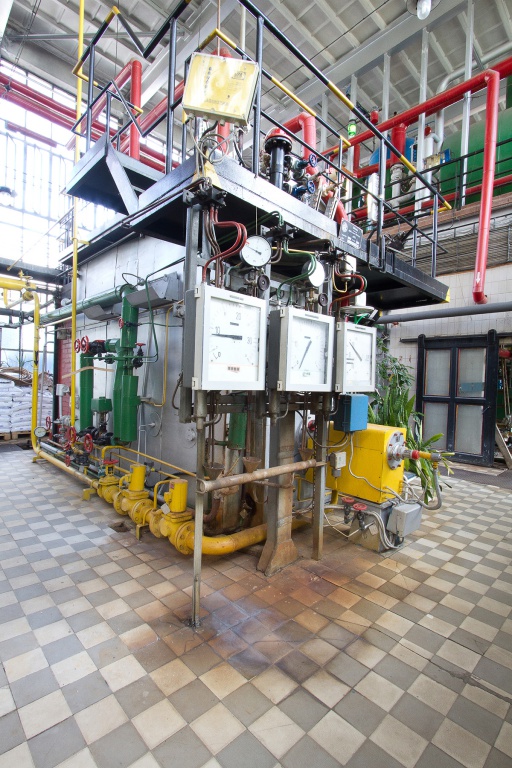
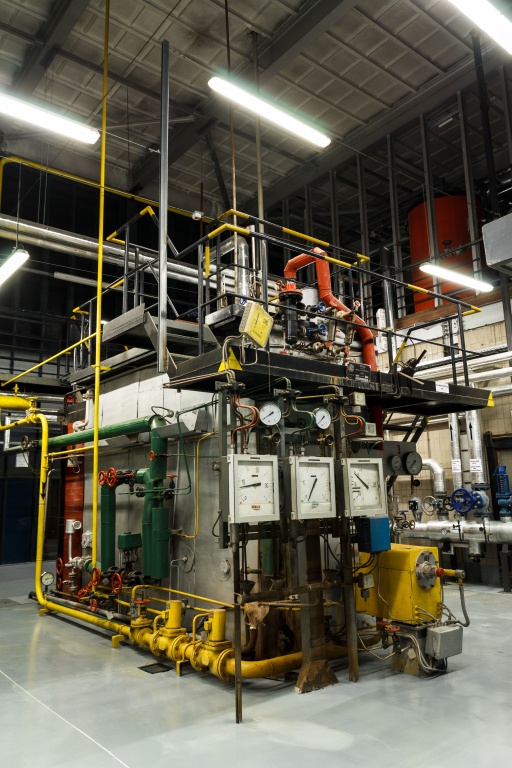
Original status of heat management at the NCI
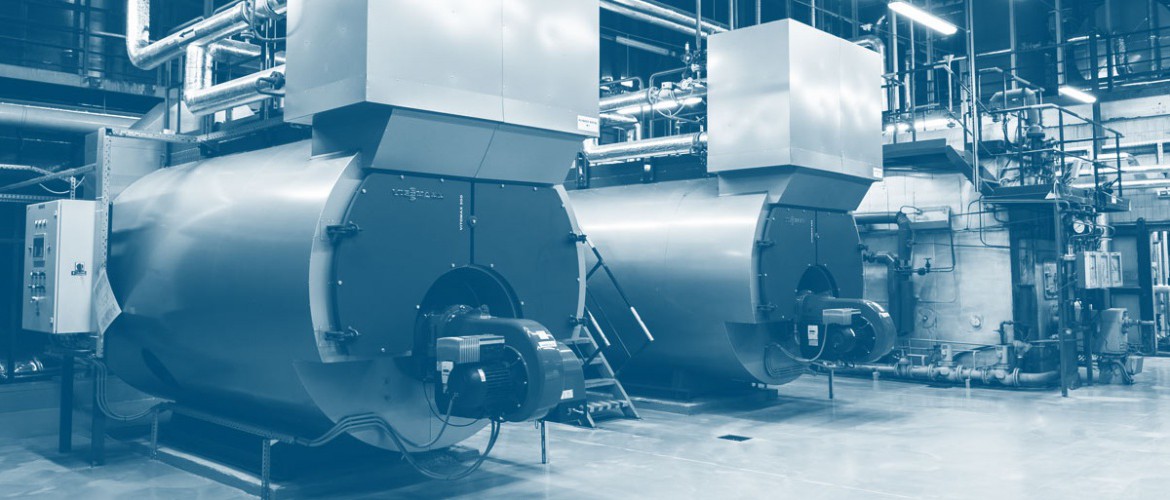
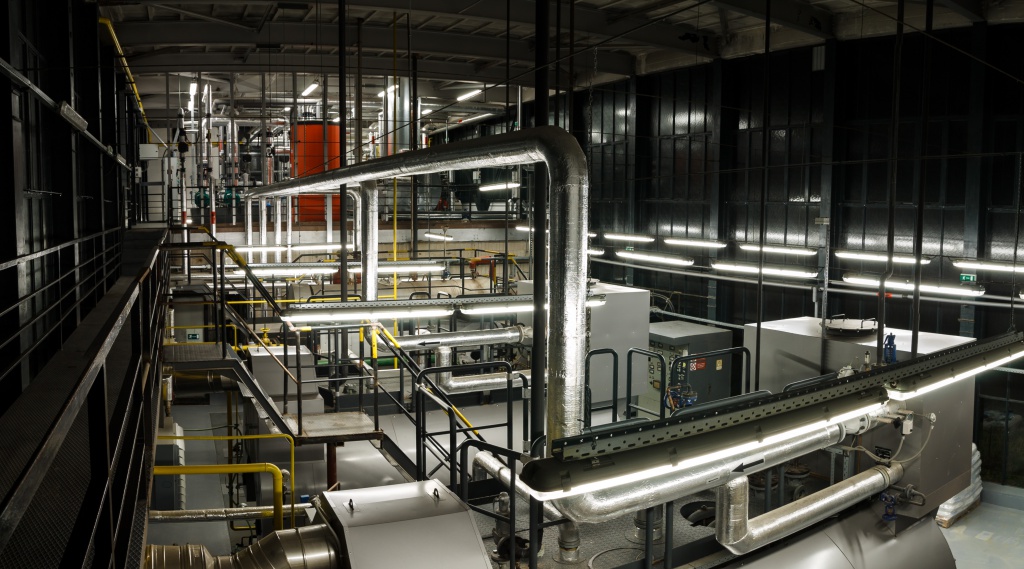
Current status of heat management at the NCI
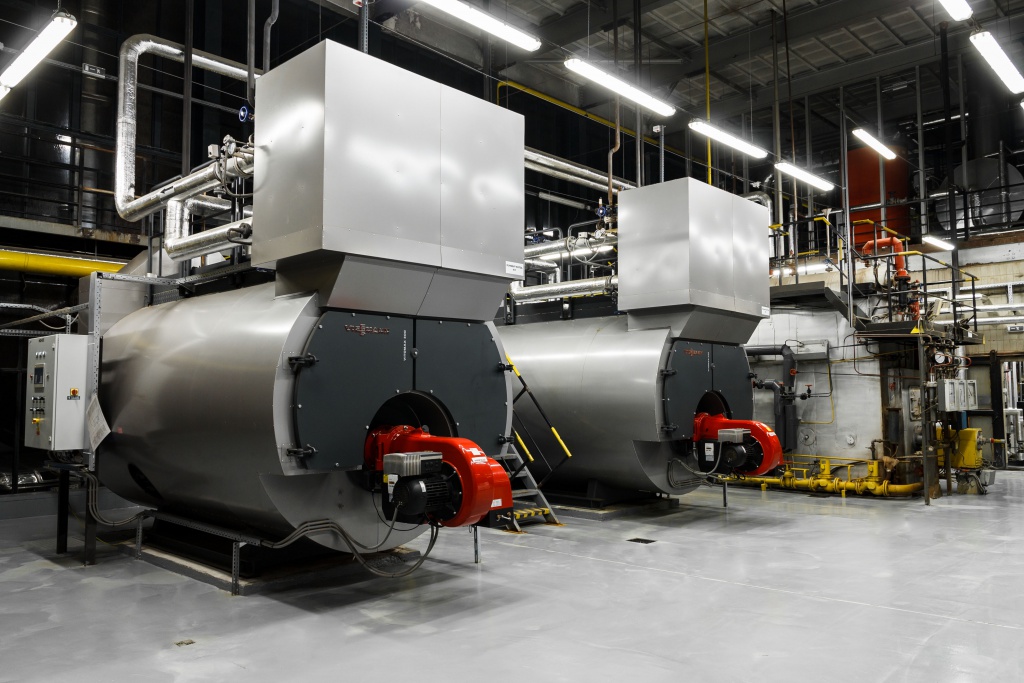
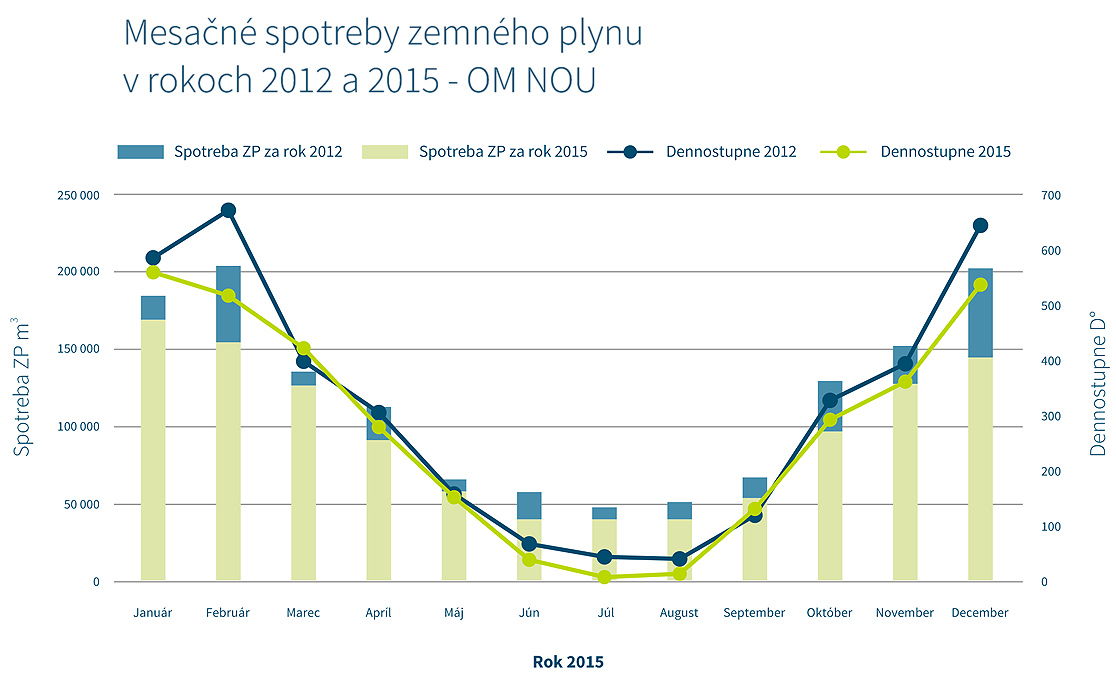
We successfully brought 2015 to a close
The consumption of natural gas for heating, hot water and steam generation for the NCI in Bratislava in 2015 can be compared the reference year of 2012 – before the refurbishment and modernisation of the primary steam boiler plant and two hot water boiler plants.
Actual objective savings in 2015, including consideration for climactic conditions:
| Savings for 2015 | DHW + technology | CH | degree day | kWh per degree day | Real savings (kWh) | ||
|---|---|---|---|---|---|---|---|
| (m3) | (kWh) | (m3) | (kWh) | (D°) | (kWh/D°) | ||
| year 2012 | 562 522 | 5 991 320 | 824 444 | 8 771 950 | 3 756 | 2 335 | |
| year 2015 | 490 050 | 5 283 053 | 643 887 | 6 909 691 | 3 339 | 2 069 | 1 707 591 |
| Savings resp. losses: DHW + technology | 11,8% | Savings resp. losses: Heating | 11,4% | 11,6% | |||
Comparison of natural gas consumption at individual points of service: Klenová 1 (central boiler plant and radiation therapy) – Vlárska (Slobodáreň boiler plant):
| Savings for 2015 | degree day D° | GAS intake | kWH per degree day CH | GAS intake | kWH per degree day ÚK | GAS intake | kWH per degree day CH | Real savings (kWh) | |||
|---|---|---|---|---|---|---|---|---|---|---|---|
| (m3) | (kWh) | (kWh/D°) | (m3) | (kWh) | (kWh/D°) | (m3) | (kWh) | (kWh/D°) | |||
| (D°) | Natural gas - Klenová 1 | Natural gas - Vlárska 11 | Natural gas - Together | ||||||||
| year 2012 | 3 756 | 1 264 070 | 13 455 322 | 1 599 | 122 896 | 1 307 949 | 304 | 1 386 966 | 14 763 270 | 1 790 | |
| year 2015 | 3 339 | 1 027 013 | 11 043 735 | 1 278 | 106 924 | 1 149 009 | 250 | 1 133 937 | 12 192 744 | 1 449 | |
| Comparison | -417 | -237 057 | -2 411 586 | -321 | -15 972 | -158 740 | -54 | -253 029 | -2 570 526 | -341 | 1 707 591 |
| Savings resp. losses | 18,8% | 17,9% | 20,1% | 13,0% | 12,2% | 17,8% | 18,2% | 17,4% | 19,1% | 11,6% | |
Table 1: Overview of climactic conditions, natural gas off-take and heat consumption for central heating for points of service in 2015
| The National Cancer Institute (NOU), Klenová 1, 833 10 Bratislava | Year 2015 | ||||||||||||
|---|---|---|---|---|---|---|---|---|---|---|---|---|---|
| Months | Outside heat To | degeree day D° | Intake in [m3] | Combustion heat | kWh | kWhCH per degree day | Intake in [m3] | Combustion heat | kWh | kWhCH per degree day | Intake in [m3] | kWh | kWhCH per degree day |
| [°C] | [D°] | Natural gas - Klenová 1 | Natural gas - Vlárska 11 | Natural gas - Together | |||||||||
| January | 2 | 560 | 152 416 | 10,7 | 1 630 851 | 2 166 | 16 282 | 10,7 | 174 217 | 311 | 168 698 | 1 805 069 | 2 423 |
| February | 1 | 520 | 137 501 | 10,695 | 1 470 573 | 2 102 | 15 467 | 10,695 | 165 420 | 318 | 152 968 | 1 635 993 | 2 368 |
| March | 6 | 423 | 111 249 | 10,708 | 1 191 254 | 1 827 | 13 407 | 10,708 | 143 562 | 339 | 124 656 | 1 334 816 | 2 095 |
| April | 11 | 282 | 78 487 | 10,732 | 842 322 | 1 548 | 10 625 | 10 732 | 114 028 | 404 | 89 112 | 956 350 | 1 848 |
| May | 15 | 153 | 50 574 | 10,824 | 547 413 | 815 | 6 187 | 10,824 | 66 968 | 438 | 56 761 | 614 381 | 1050 |
| June | 20 | 42 | 38 179 | 810,917 | 416 800 | 0 | 2 487 | 10,917 | 27 151 | 0 | 40 666 | 443 951 | 0 |
| July | 24 | 10 | 38 092 | 10,886 | 414 670 | 0 | 2 368 | 10,886 | 25 778 | 0 | 40 460 | 440 448 | 0 |
| August | 24 | 17 | 37 250 | 10,781 | 401 592 | 0 | 2 578 | 10,781 | 27 793 | 0 | 39 828 | 429 386 | 0 |
| September | 16 | 133 | 49 872 | 10,835 | 540 363 | 983 | 3 068 | 10,835 | 33 242 | 250 | 52 940 | 573 605 | 1 009 |
| October | 10 | 295 | 86 723 | 10,776 | 934 427 | 1 741 | 9 430 | 10,776 | 101 618 | 344 | 96 153 | 1 036 145 | 1 981 |
| November | 8 | 364 | 117 506 | 10,74 | 1 262 014 | 2 352 | 10 528 | 10,74 | 113 071 | 311 | 328 034 | 1 375 085 | 2 581 |
| December | 2 | 540 | 129 164 | 10,772 | 1 391 355 | 1 797 | 14 497 | 10,772 | 156 162 | 289 | 143 661 | 1 547 516 | 2 030 |
| Sum | 12 | 3 339 | 1 027 013 | 10,781 | 11 043 735 | 1 278 | 106 924 | 10,781 | 1 149 009 | 250 | 1 133 937 | 12 192 744 | 1 449 |
Table 2: Overview of climactic conditions, natural gas off-take and heat consumption for central heating for points of service in 2012
| The National Cancer Institute (NOU), Klenová 1, 833 10 Bratislava | Year 2012 | ||||||||||||
|---|---|---|---|---|---|---|---|---|---|---|---|---|---|
| Months | Outside heat. To | degeree day D° | Intake in [m3] | Combustion heat | kWh | kWhCH per degree day | Intake in [m3] | Combustion heat | kWh | kWhCH per degree day | Intake in [m3] | kWh | kWhCH per degree day |
| [°C] | [D°] | Natural gas - Klenová 1 | Natural gas - Vlárska 11 | Natural gas - Together | |||||||||
| January | 1 | 665 | 164 278 | 10,627 | 1 745 782 | 2 171 | 18 070 | 10,627 | 192 030 | 328 | 182 348 | 1 937 812 | 2 447 |
| February | -3 | 665 | 182 826 | 10,62 | 1 941 612 | 2 251 | 18 801 | 10,62 | 199 667 | 300 | 201 627 | 2 141 279 | 2 508 |
| March | 7 | 404 | 119 604 | 10,63 | 1 271 391 | 1 969 | 13 042 | 10,63 | 138 636 | 343 | 132 646 | 1 410 027 | 2 236 |
| April | 10 | 306 | 100 349 | 10,635 | 1 067 212 | 1 982 | 9 922 | 10,635 | 105 520 | 345 | 110 271 | 1 172 732 | 2 230 |
| May | 15 | 160 | 58 077 | 10,647 | 618 346 | 886 | 5 774 | 10,647 | 61 476 | 384 | 63 851 | 679 822 | 1 078 |
| June | 19 | 68 | 51 199 | 10,688 | 547 215 | 1 238 | 4 089 | 10,688 | 43 703 | 643 | 55 288 | 590 918 | 1 443 |
| July | 21 | 46 | 42 859 | 10,674 | 457 477 | 0 | 2 896 | 10,674 | 30 912 | 0 | 45 755 | 488 389 | 0 |
| August | 21 | 35 | 46 660 | 10,666 | 497 676 | 0 | 2 859 | 10,666 | 30 494 | 0 | 49 519 | 528 170 | 0 |
| September | 16 | 126 | 61 939 | 10,659 | 660 208 | 1 453 | 3 116 | 10,659 | 33 213 | 264 | 65 055 | 693 421 | 1 473 |
| October | 9 | 329 | 117 387 | 10,653 | 1 250 524 | 2 398 | 10 617 | 10,653 | 113 103 | 344 | 128 004 | 1 363 627 | 2 652 |
| November | 7 | 392 | 137 939 | 10,653 | 1 469 464 | 2 571 | 13 416 | 10,653 | 142 921 | 365 | 151 355 | 1 612 385 | 2 860 |
| December | -1 | 640 | 180 953 | 10,657 | 1 928 416 | 2 268 | 20 294 | 10,657 | 216 276 | 338 | 201 247 | 2 144 689 | 2 558 |
| Sum | 10 | 3 756 | 1 264 070 | 10,651 | 13 455 322 | 1 599 | 122 896 | 10,651 | 1 307 949 | 304 | 1 386 966 | 14 763 270 | 1 790 |